Lab Experiments
Basic Experiment
Our case: H~1~: "The screen size of a mobile phone has an effect on the perceived usability of mobile Facebook Interface"

Manipulating the independent variable
Defining the levels/conditions/groups/treatments

Narrowing down the number of levels
- We select the extreme cases - in our example 2.4’’ and 5.5’’
- We select most common conditions with the largest possible distance - in our example 4.0" and 5.5"
- We group the cases into two categories - in our example small screens and large screens
- Other ways that are meaningful in the context of our experiment

Using THE RULE
- The two conditions must differ only in relation to the independent variable

Selecting participants
- We need to select a sample that will participate in our experiment that is representative of the population
- The population is defined as all the individuals of interest
- With proper sampling we assume the results we will get from the sample will also apply to the population
Sampling Techniques
- Probability sampling
- Each member of the population has a specifiable probability of being chosen to participate in our experiment
- Nonprobability sampling
- The probability of any particular member of the population to be chosen is unknown
Assigning Participants to Conditions
Within-group designs

- The same participants experience both conditions
- Often called repeated measures design
Advantages
- We need less participants
- The systematic error caused by the participants will be the same in both conditions - easier to get better results
Disadvantages
- Hard to control the practice, order, and fatigue effects
Counterbalancing
- All possible orders of conditions are included in the experiment

Between-group designs

- Different participants experience the conditions
- Often called independent groups design
Advantages
- Easier to control the practice, order, and fatigue effects - often do not exist
Disadvantages
- We need many participants
- The systematic error caused by the participants' characteristics is more difficult to control
Statistical Technique
- Within-group design => Paired samples t-tes

- Between-group design => Independent t-test

Reporting
We conducted an independent samples t-test to locate possible interaction effects.
Results showed a statistically significant different in the perceived usability scores for the participants that used the large phone (M=XX, SD=XX) and the ones that used the small one (M=XX, SD=XX).
t(58)=1.329,\quad p=.013
The rule for every statistical test
- Make sure you follow the test's assumptions!
What if we have more than two conditions?

Which statistical technique to use?
- More than two conditions
- One categorical independent variable
- One continuous dependent one

Reporting
In order to test if the three groups were affected in their perceptions on usability by the screen size, we conducted oneway independent ANOVA
Having one independent variable (screen size) and one dependent variable (perceived usability).
No significant effects were observed: F(2,57)=1.532,\quad p=.225.
Complex experiment
...
Interpretation of Factorial Designs
- We can have two types of results
- Results about the effect of each independent variable on the dependent variable (main effect)
- The effect of the independent variable on the dependent by itself
- Results about the interaction between the two independent variables (the effect of one independent variable depends on the particular level of the other one)
Result

Possible outcomes of experiment
- There may or may not be a significant main effect for screen size
- There may or may not be a significant main effect for weight
- There may or may not be a significant interaction between screen size and weight
Assigning Participants in Factorial Designs
- All participants are different in each condition
- Independent groups (between-subjects) factorial design
- The same subjects participate in all conditions
- repeated measures (within-subjects) factorial design
- Combinations of the above
- mixed factorial design
Example
Independent variable A (two levels A1, A2), Independent Variable B (B1, B2) have an effect on a Dependent Variable

Which statistical technique to use?
More than 2 experimental conditions, more than 2 categorical independent variables, one continuous dependent one

Normality Test
-
We check whether our distribution deviates from a normal distribution
-
H1: “Our distribution is different from a normal distribution”
-
H0: “Our distribution is the same as a normal distribution”
-
Two tests:
- Kolmogorov-Smirnov, and
-
Shapiro-Wilk
-
Analyze \to Descriptive Statistics \to Explore
- If the tests are significant p<0.05 then our distribution is significantly different from a normal distribution
Tests for homogeneity of variance
- H1: “Our variances are not equal among the groups”
- H0: “Our variances are equal among the groups”
- A typically used test:
- Lavene’s Test
- Analyze \to Descriptive Statistics \to Explore
- If the test is significant p<0.05 then our variances are significantly different in the different groups.
Reducing the bias
- Trimming the data
- Winsorizing
- Bootstrapping (too advanced for this course)
- Transforming the data
OR
- We select an advanced technique that does not assume normality of the data (way too advanced for this course)
Trimming Data
- We delete some scores from the extremes/outliers
- Only when we have good reasons to do so
- We use two rules
- We trim a percentage from each end of the ordered scores (i.e. 5%)
- We trim data above a certain number of standard deviations (usually 3)
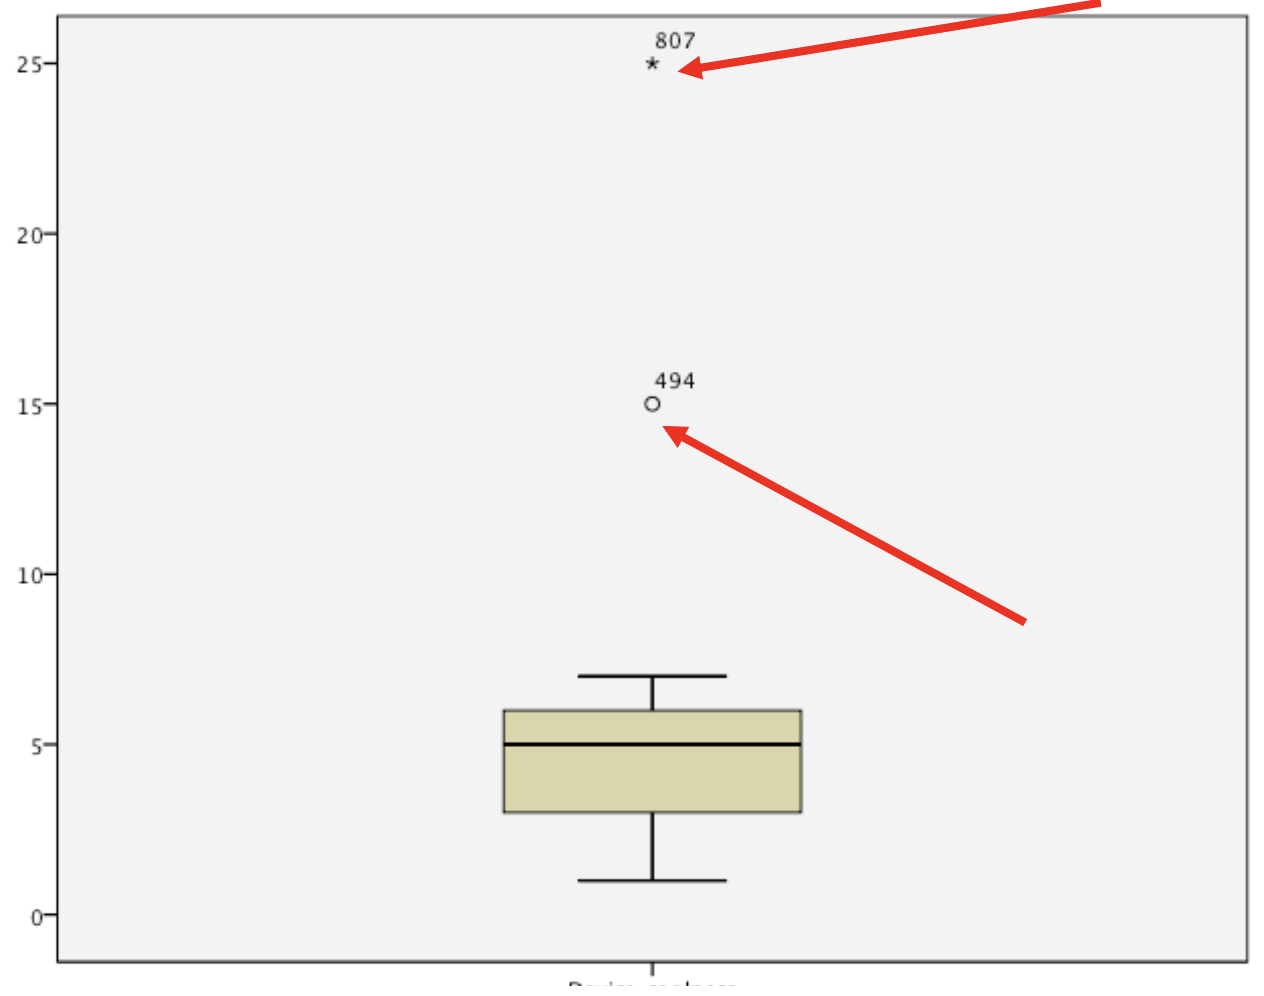
Spotting Outliers
Winsorizing
- We replace outliers with:
- The highest score that is not an outlier
- Or we replace extreme scores with
- A score three standard deviations from the mean
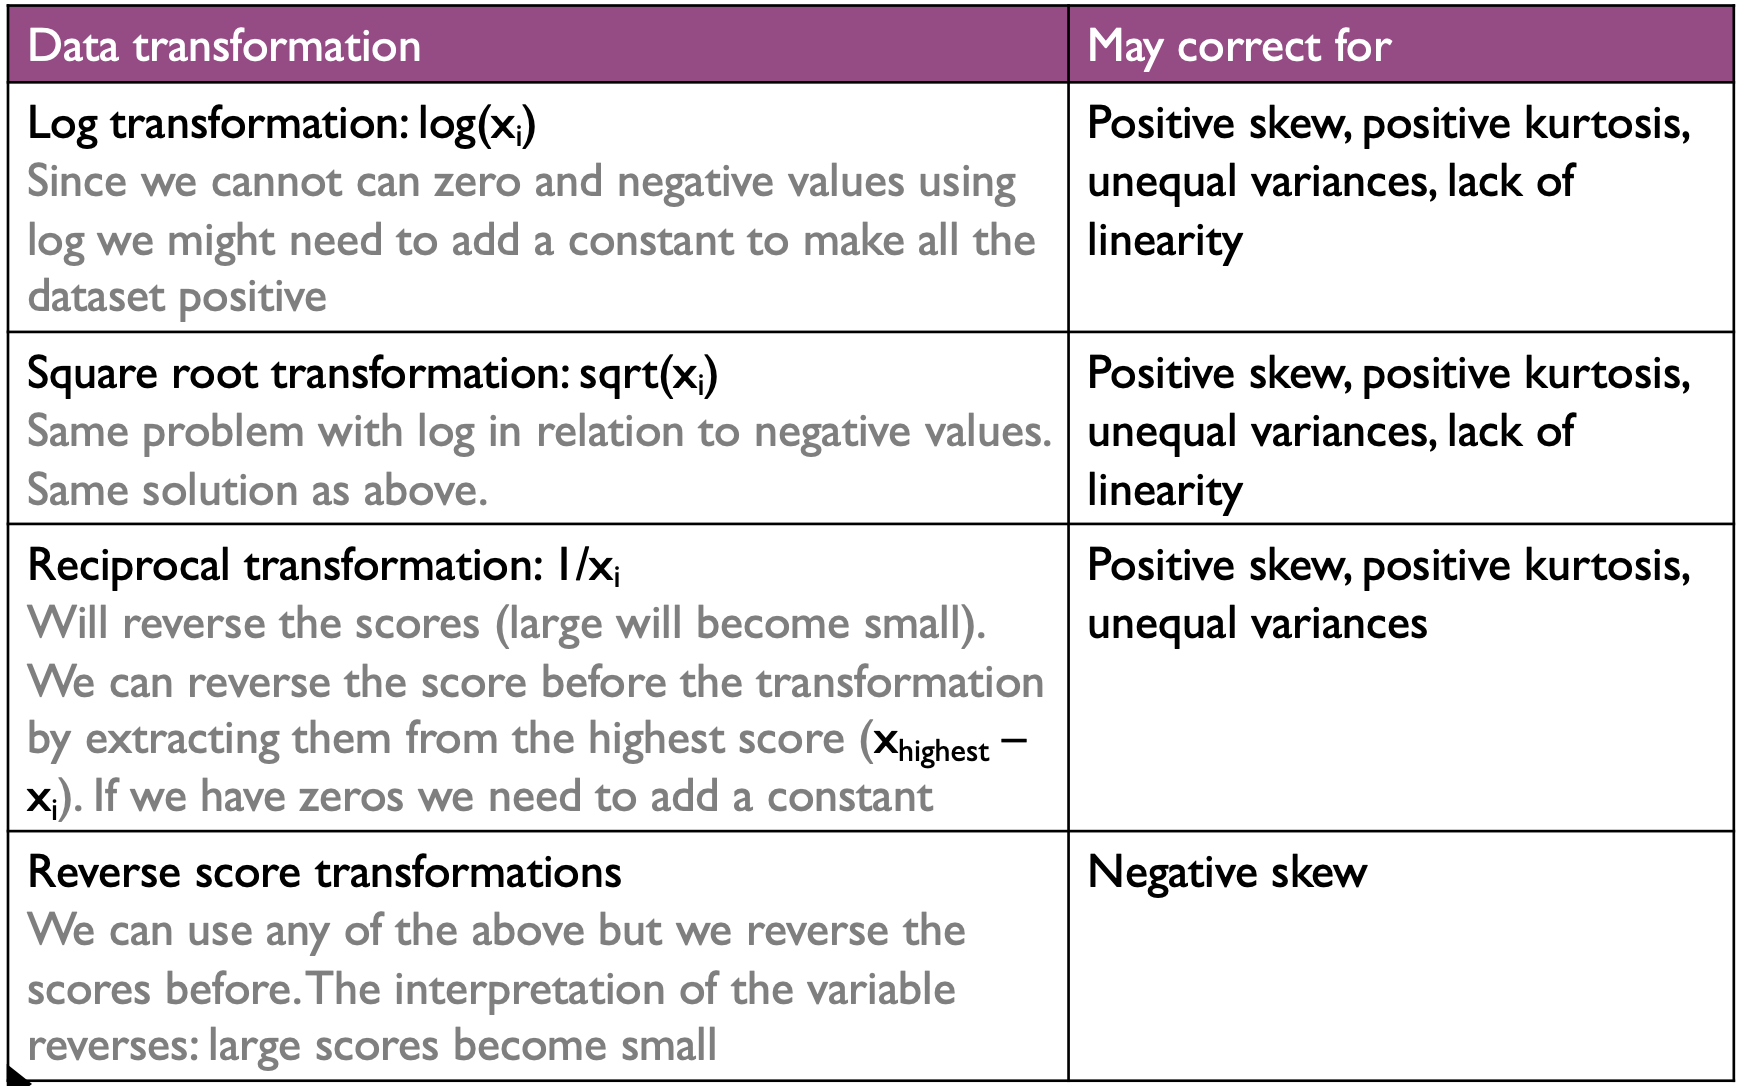
Transforming the Data
- If we are looking the relationships between two or more variables, we can transform only the problematic one
- If we are looking for differences with one variable (i.e. a change in a variable over time) then we need to transform all of them in order to have the same units of measurement
- When we transform the data we basically change our hypothesis and we address a different variable than the originally measured
- The consequences for applying the ‘wrong’ transformation can be worst than analyzing the original ones
Choosing Transformation